Ask around long enough and someone will tell you the Toronto market is doing what it did in 1989. It is a comparison worth taking seriously — and worth checking, because the 1989 correction is the only other event in this market’s recorded history that looks anything like the one we are in.
So let us check it properly, using Toronto Regional Real Estate Board data rather than recollection. What follows is the shorter, decision-focused version of an analysis I have published in full on my main site. If you are weighing a property decision right now — including families dealing with an inherited or estate property, where the choice of when to sell often gets framed as “wait for the market to come back” — the numbers below are the ones that matter.
Key takeaways
- Toronto’s current correction runs from a February 2022 monthly peak of $1,334,544 to $1,003,956 in July 2026 — roughly 24.8% lower.
- After 1989, prices fell for seven straight years and finished 27.5% down.
- The 1989 cycle needed thirteen years to regain its old nominal peak.
- Measured consistently, today’s decline is shallower at the same point in the cycle.
- The economics are not the same: no recorded recession, far lower unemployment, but roughly double the household debt.
- The previous peak is a historical observation, not a price anyone can sell at today.
Is Toronto real estate like 1989?
In shape, yes. In cause, no.
Both corrections followed a rapid price run-up. Both followed a sharp increase in interest rates. In both, sales volume fell before prices did. Both have unfolded over years rather than months.
But the 1989 correction happened during a genuine recession, with a Bank Rate that touched 14.05% and Ontario unemployment that reached 11.6%. People were losing jobs, not merely facing larger payments. Nothing comparable has been recorded in the current cycle.
So the pattern rhymes. The engine driving it does not. That distinction matters more than the resemblance.
How far have Toronto home prices fallen since 2022?
The board-wide average selling price reached $1,334,544 in February 2022 and stood at $1,003,956 in July 2026. That is a fall of about 24.8% across 53 months.
One clarification, because it trips people up. February 2022 was a spike month, not a settled level — it sits roughly 12% above the 2022 calendar-year average. Compare annual averages instead, which is what you must do to reach back to 1989, and the same decline measures about 13.5%.
Neither figure is wrong. They answer different questions. Roughly 24.8% is the drop from the market’s hottest single month. Roughly 13.5% is the drop in the market’s typical year.
What actually happened after 1989
The annual average selling price peaked at $273,698 in 1989, after more than tripling from $75,694 in 1980. Then came seven consecutive years of decline, ending at $198,317 in 1996 — 27.5% below the peak.
There is a detail in that period I find more instructive than the headline. Sales bottomed in 1990. Prices bottomed in 1996. Six years apart. Buyers returned to the market long before prices stopped falling — which is a useful caution for anyone treating a pickup in activity as the all-clear.
How long did Toronto real estate take to recover after 1989?
Thirteen years. The annual average did not pass its 1989 level until 2002, at $277,375. Seven years falling, six years climbing back — and that is in nominal dollars, before accounting for what inflation did to their value over the same stretch.
Worth sitting with: nobody in 1996 knew they were standing at the bottom. It only became visible years later, once the data had been published.
Lining the two corrections up: Peak = 100
Comparing 1989 dollars with 2022 dollars directly tells you nothing. The fix is to index each cycle to its own peak — set the peak year to 100 and track the annual average from there.
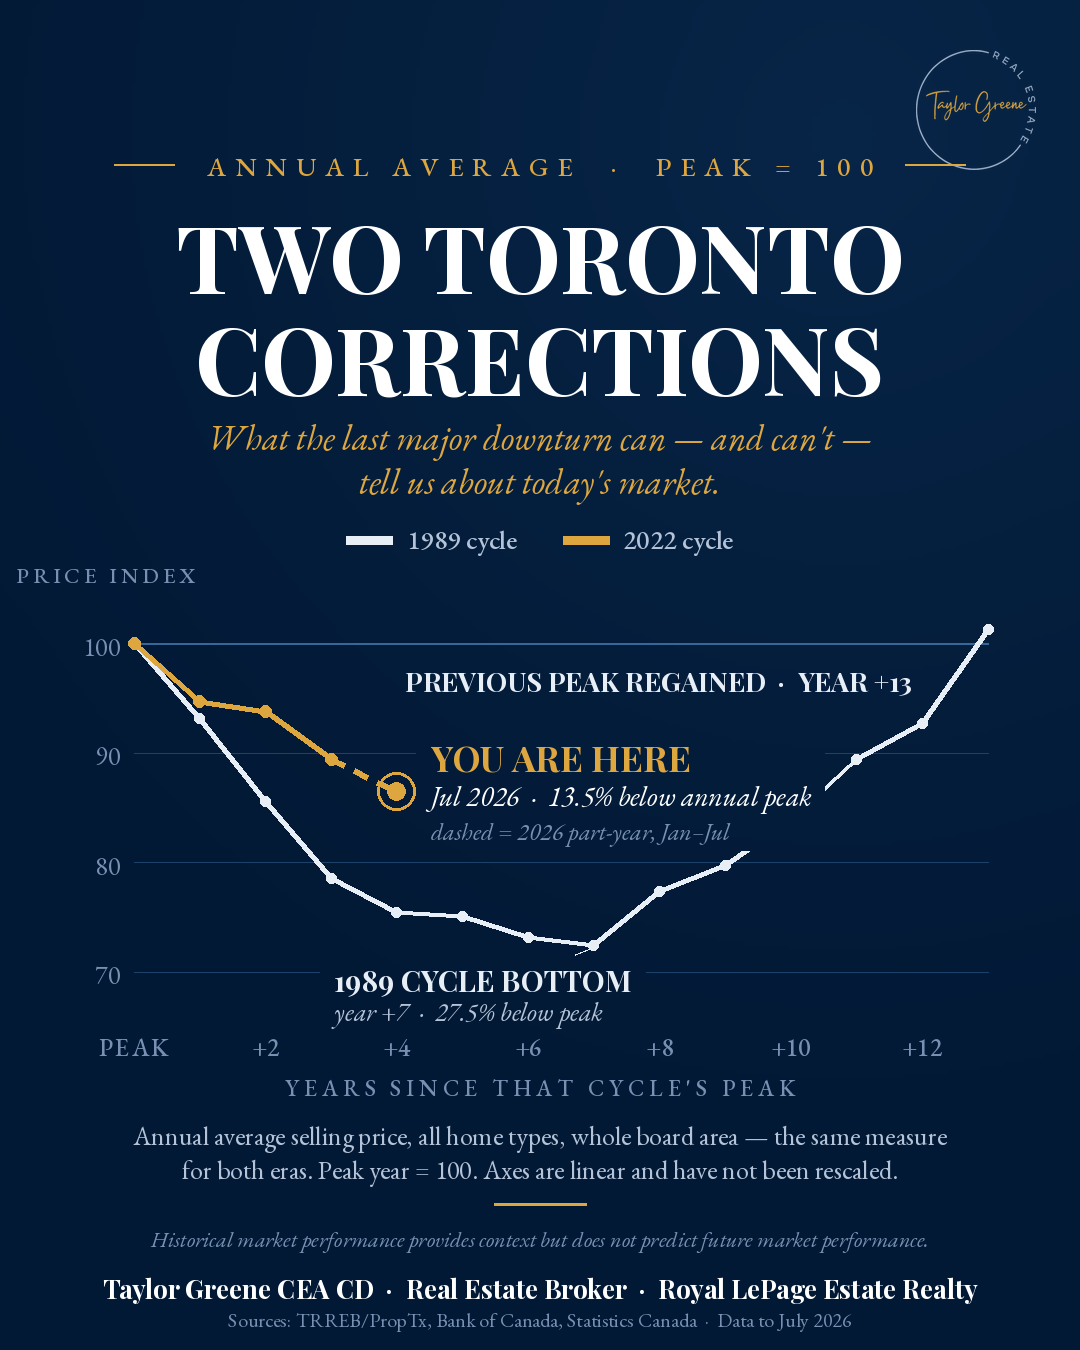
| Years after the peak | 1989 cycle | 2022 cycle |
|---|---|---|
| Peak year | 100.0 | 100.0 |
| +1 | 93.2 | 94.8 |
| +2 | 85.6 | 93.8 |
| +3 | 78.5 | 89.5 |
| +4 | 75.4 | 86.5 |
Four years past each peak: the 1989 cycle had lost 24.6%, the current one 13.5%. Today’s correction is running at roughly half the depth of its predecessor at the equivalent moment.
The word doing quiet work there is so far. July 2026 is the lowest reading of this cycle to date. A low so far is not a confirmed bottom.
Where the two corrections genuinely differ
| 1989 cycle | Today | |
|---|---|---|
| Interest rates | Bank Rate 14.05%, 1990 | Overnight target 2.25% |
| Recession | Yes, 1990–91 | None recorded |
| Unemployment, Ontario | 11.6%, September 1992 | 6.8%, July 2026 |
| Household debt to income | About 90% | 179.6% |
| Population | Rising throughout | Toronto CMA −992, 2024–25 |
Read that table in pairs and it tells a coherent story. Households today are in far better shape on income and employment, and far worse shape on leverage. A rate move that would have been absorbed in 1990 lands harder on a balance sheet carrying twice the debt.
The population line is genuinely new. Toronto CMA population fell by 992 between the July 2024 and July 2025 estimates. Through the whole 1989–96 decline, the region kept growing. Demand had a floor under it then that we cannot currently assume.
How long can a Toronto housing correction last?
The honest answer from the only comparable episode on record: years. Seven of them going down, thirteen to fully recover in nominal terms.
That is not a forecast for this cycle. The conditions differ enough that the timeline should not simply be copied across. What the 1989 experience does establish is a realistic sense of scale — and it argues strongly against any plan built on the market turning within a few months.
Why today’s value matters more than the old peak
This is the part I care most about, and it is where I see the most avoidable damage done.
A property’s February 2022 value is not an option available to you. It is a number in a historical series. The only price that exists is the one a buyer will pay in the market you are actually in.
Holding out for a number the market has already left behind is not a neutral act. Every month of waiting costs something real — mortgage interest or lost capital, property tax, insurance, utilities, upkeep, and for a vacant property, the additional cost and risk of it sitting empty. Those costs are certain. The recovery date is not.
And if you are selling in order to buy, a lower market is usually a net positive: you sell for less, but you buy for less, and in most moves the purchase is the larger number.
So the question worth asking is not “has the market bottomed?” — which nobody can answer from inside it, as 1996 demonstrated. It is “given my timeline, my costs and my circumstances, does moving make sense now?” That question has an answer.
Frequently asked questions
Is Toronto’s current correction as bad as 1989?
Not so far. On a consistent annual-average basis, the 1989 cycle was down 24.6% four years after its peak; the current cycle is down about 13.5% at the same point. The 1989 correction also ran alongside a recession and double-digit Ontario unemployment, neither of which has occurred this time.
What can Toronto’s 1989 housing correction tell us about today’s market?
Mainly two things: that Toronto corrections have historically resolved over years rather than months, and that price bottoms are only identifiable in hindsight. It does not supply a date for this cycle.
Will Toronto home prices recover?
Toronto prices did recover after 1989, though it took until 2002 to pass the old nominal peak. Nobody can responsibly tell you when or whether this cycle repeats that. Any specific recovery date you are offered is a guess presented as a fact.
Should I wait for prices to come back before selling?
Only if you can carry the property indefinitely and have no competing use for the proceeds. Waiting has certain monthly costs and an uncertain payoff. If you are also buying, waiting often costs more than it saves.
Does this analysis apply to my specific property?
Not directly. These are board-wide averages across all home types. Individual neighbourhoods and property types have moved very differently in this cycle — condominium apartments and detached houses in particular. A board-wide average is the right tool for comparing two eras and the wrong tool for pricing a house.
Sources and method. Price figures are the average selling price for all home types across the entire TRREB market area, from the Toronto Regional Real Estate Board’s MLS® System. This is an average, not the MLS® Home Price Index benchmark; the HPI only begins in 2012 and cannot reach the 1989 cycle, which is why average price is used for both eras. Peak = 100 means each cycle’s peak year is indexed to 100 and later years expressed as a percentage of it. The 2026 figure covers January to July, weighted by sales volume. Interest rates: Bank of Canada. Unemployment (Ontario, monthly, seasonally adjusted) and household debt: Statistics Canada. Population: Statistics Canada population estimates by census metropolitan area. Market data: TRREB.
Want the full analysis? The complete comparison — including the year-by-year series, the sales-before-prices pattern, and a detailed methodology note — is published as the full Toronto housing market analysis on my main site.
About the author. Taylor Greene is a Real Estate Broker with Royal LePage Estate Realty and holds the Certified Executor Advisor (CEA) designation — training focused on the practical side of estate work, which is often where the “should we wait?” question gets asked. Circle of Life Real Estate serves Toronto’s east end and the GTA. Nothing here is legal, tax or financial advice; for those questions you should speak with a lawyer or accountant.
Historical market performance provides context but does not predict future market performance. Not intended to solicit clients currently under contract with another brokerage.
If you are working through a property decision, you can see how I help, download the free executor handbook, read the executor’s guide to selling an estate home in Toronto and the GTA, or book a consultation.